Moving Dialogs
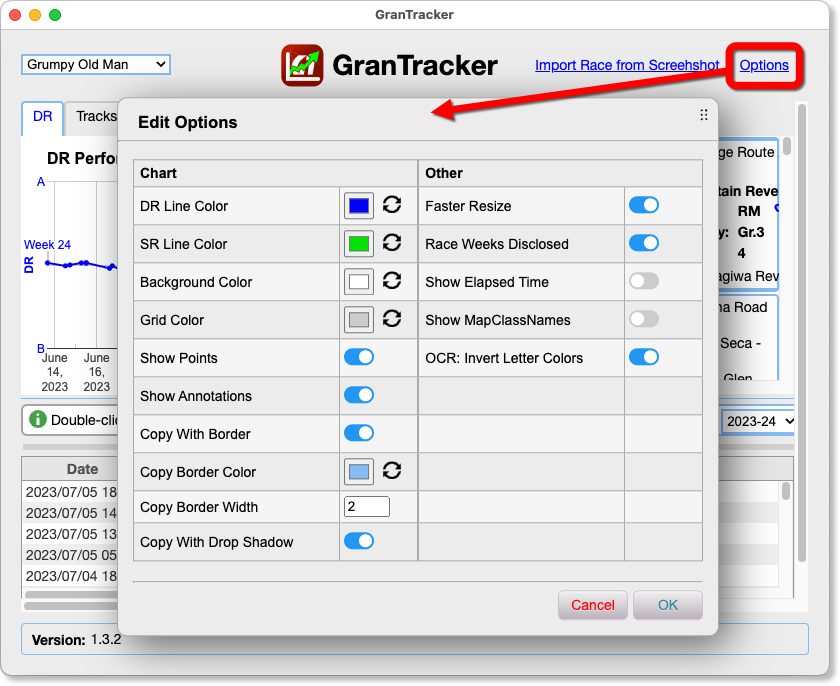
Clicking on “Options” in the top right of the screen brings up the Edit Options dialog:
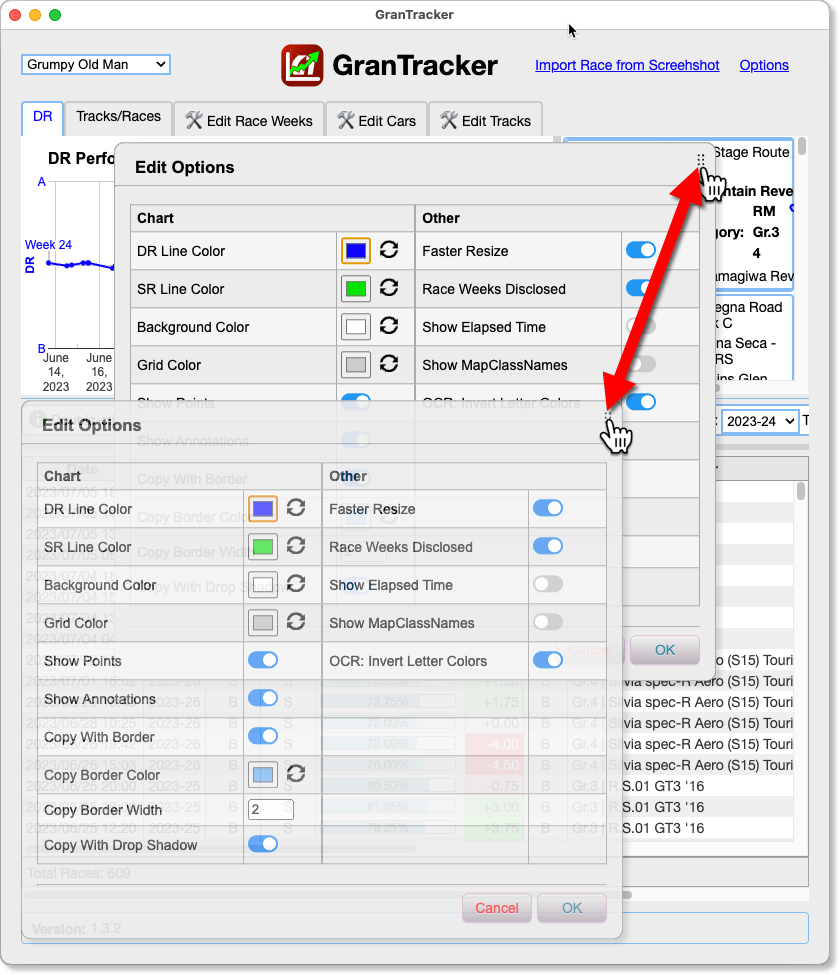
You can click on the drag thumb in the upper right of the dialog, and move it around the screen:
And since the first part of the Options dialog applies to the DR Chart, I dragged it below the chart so we can see effect changing an option has:
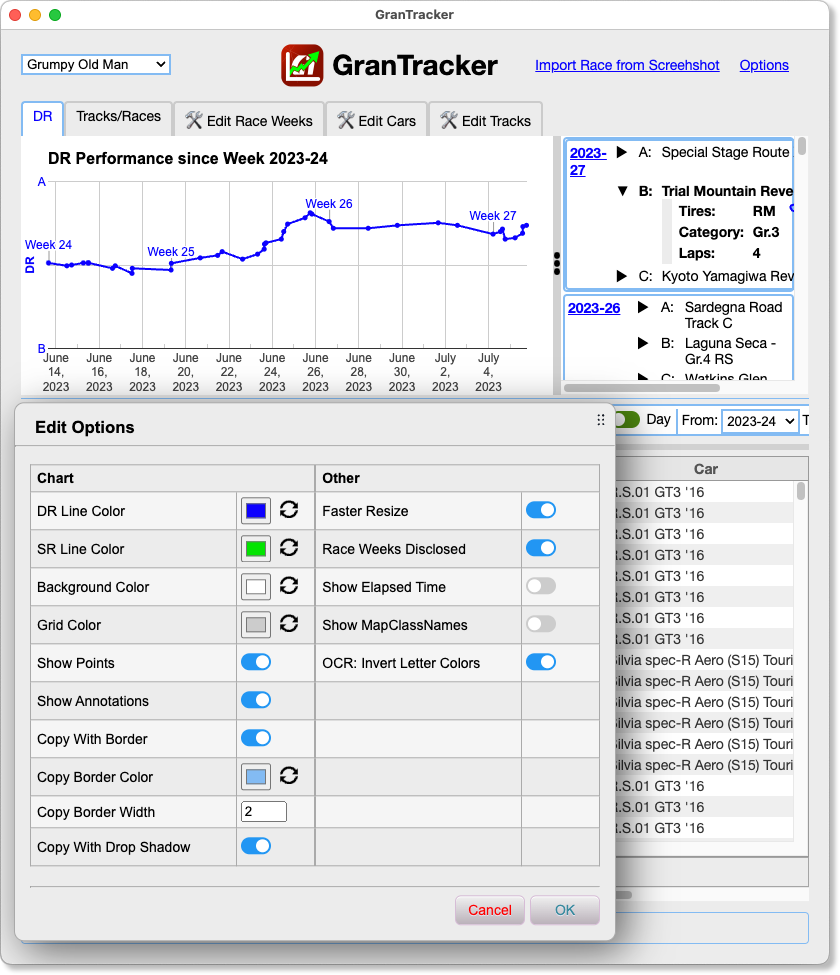
Chart Options
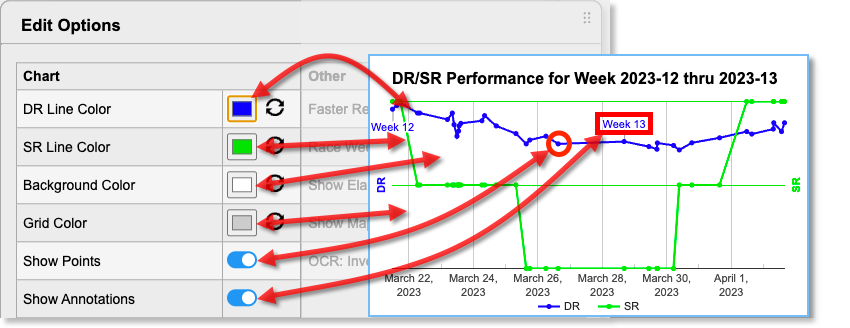
The left side of the Options dialog deals with Chart options, and the first part of that controls how the chart is displayed in the application. For an explanation of how to use the Color Pickers, see Color Sets.
| Name | Description |
|---|---|
| DR Line Color | The color of the line that represents DR progress, shown here in blue. The button resets the color to its original value. |
| SR Line Color | The color of the SR line, if visible. Shown here in green. |
| Background Color | The color of the chart’s background, which defaults to white. |
| Grid Color | The color of the vertical grid lines. It defaults to gray. |
| Show Points | “Points” are the little circles on the lines that represent individual races. You can toggle them on or off here. |
| Show Annotations | “Annotations” are the text that say “Week 1”, etc. You can toggle them on or off here. |